Try it
This one is yours to drive.
Select two stations to plan a journey. Drag to pan, and hover a station or a piece of track for its details. Hold Ctrl or ⌘ and scroll to zoom, or pinch.
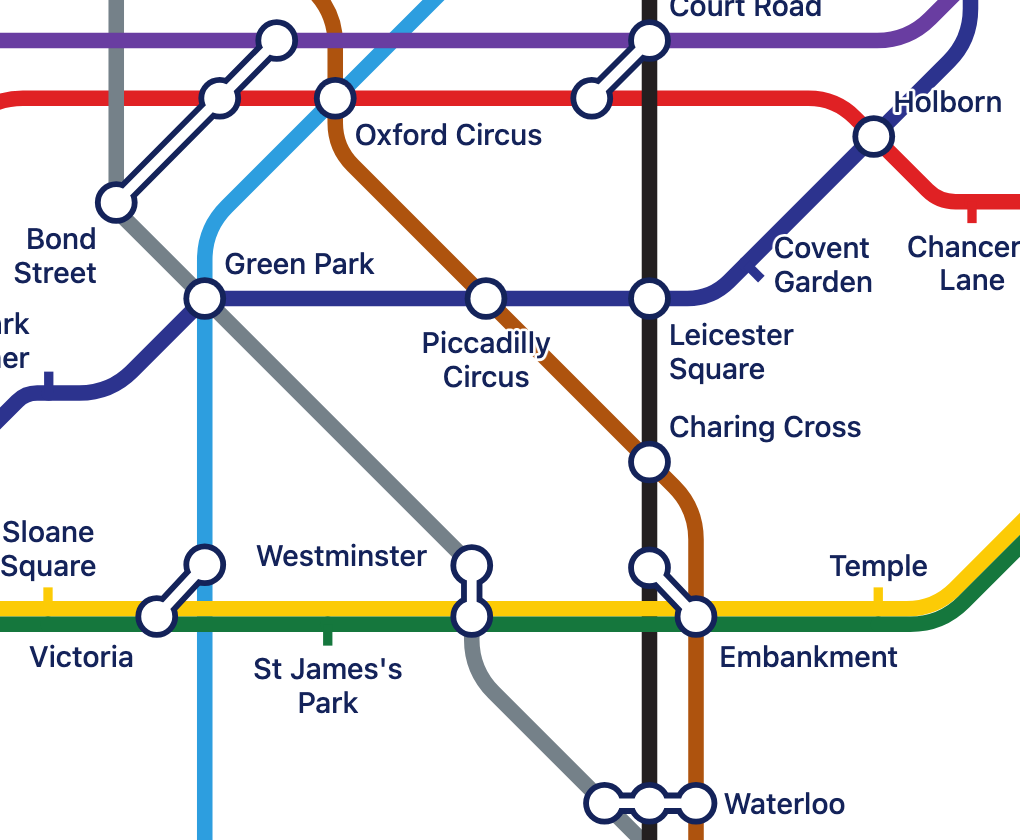
The metro network has positions. The workflow has none, so tubeline placed its stations itself. The city only draws the stations that are in view.
Why
People already know how to read one.
They follow a line with a finger, see where to change, and plan a route without being taught.
tubeline borrows that for any graph: a workflow, a state machine, a build pipeline, a service map, or a real transit network.
- A node
- A station
- A named path through nodes
- A line, in its own colour
- A node on several paths
- An interchange
- A directed edge
- Track with an arrow
- An edge's weight
- The cost of that step in a journey
- Data on a node or edge
- A tooltip
Start
A map in a minute.
import { createTubeMap } from '@nikhilverma/tubeline'

const map = createTubeMap(document.querySelector('#map'), {
  name: 'Order workflow',
  stations: [
    { id: 'cart', name: 'Cart' },
    { id: 'checkout', name: 'Checkout' },
    { id: 'paid', name: 'Paid', metadata: { owner: 'billing' } },
    { id: 'cancelled', name: 'Cancelled' },
  ],
  lines: [
    { id: 'happy', name: 'Happy path', stations: ['cart', 'checkout', 'paid'] },
    { id: 'cancel', name: 'Cancellation', stations: ['checkout', 'cancelled'] },
  ],
})

map.showJourney('cart', 'cancelled')
The map fills its container, so give the container a height. The README has the full JSON format and API.
First principles
Six rules draw the whole map.
-
It is a graph first
The tube map is the interface. Underneath are nodes, paths and weighted, directed edges. Nothing in the library knows about trains.
-
Eight directions only
Every stretch of track is horizontal, vertical or at 45°. This one rule is most of what makes a tube map look like a tube map.
-
Straight through stations
Each stretch gets at most one bend, and the bend sits away from the stations where it can.
-
Shared track, side by side
Lines that travel together touch, keep their order, and share one station mark.
-
Routing apart from drawing
Journey planning never touches the page, so the same code runs in Node, in tests and on a server.
-
The map keeps to itself
It is drawn in a shadow root. Your page's styles and the map's styles can't affect each other.
Accuracy
How close is it to a real tube map?
We measured it. We took a small area of central London from the official map, gave tubeline the same stations at the same positions, and compared the two drawings pixel by pixel.
- Pixels that differ
- 14.2%
- Victoria line overlap
- 0.92
- Central line overlap
- 0.86
- Bakerloo line overlap
- 0.84
- Jubilee line overlap
- 0.43
Overlap is the share of pixels the two drawings of a line have in common. The typeface, the symbols and the river make up most of what still differs.
For coding agents
Hand it to your agent.
Paste this into your agent. The brief covers the JSON, the API and the common mistakes in one short file.
Read https://nikhil-verma.com/tubeline/llms.txt and use @nikhilverma/tubeline to draw this graph as an interactive tube map in this TypeScript project.
Or install it as a skill:
npx skills add NikhilVerma/tubeline